
A 40% email open rate might look like a win, but privacy features can inflate that number. So how do you know whether your campaigns are reaching and engaging your audience?
This guide covers 2026 open rate benchmarks, from industry averages to cold email and B2B outreach. You’ll learn how to calculate open rates, interpret engagement metrics, and use AI and connected customer data to refine campaigns with monday campaigns.
Key takeaways
- Measure engagement: Track click-to-open rates (CTOR), conversions, and revenue alongside open rates. Privacy features can affect both open rates and CTOR.
- Use benchmarks as a guide: A 15-25% open rate can provide a starting point, but benchmarks vary by industry and methodology. Apple’s privacy features can inflate reported open rates.
- Maintain your email list: Review your list every 3-6 months and segment subscribers by behavior to make your messages more relevant.
- Test your campaigns: Experiment with subject lines, send times, and personalization to learn what resonates with your audience.
- Connect campaigns to customer data:Use AI to help refine subject lines, send times, and audience targeting. With monday campaigns, you can connect campaign reporting to CRM data for a broader view of performance.
What is a good email open rate?
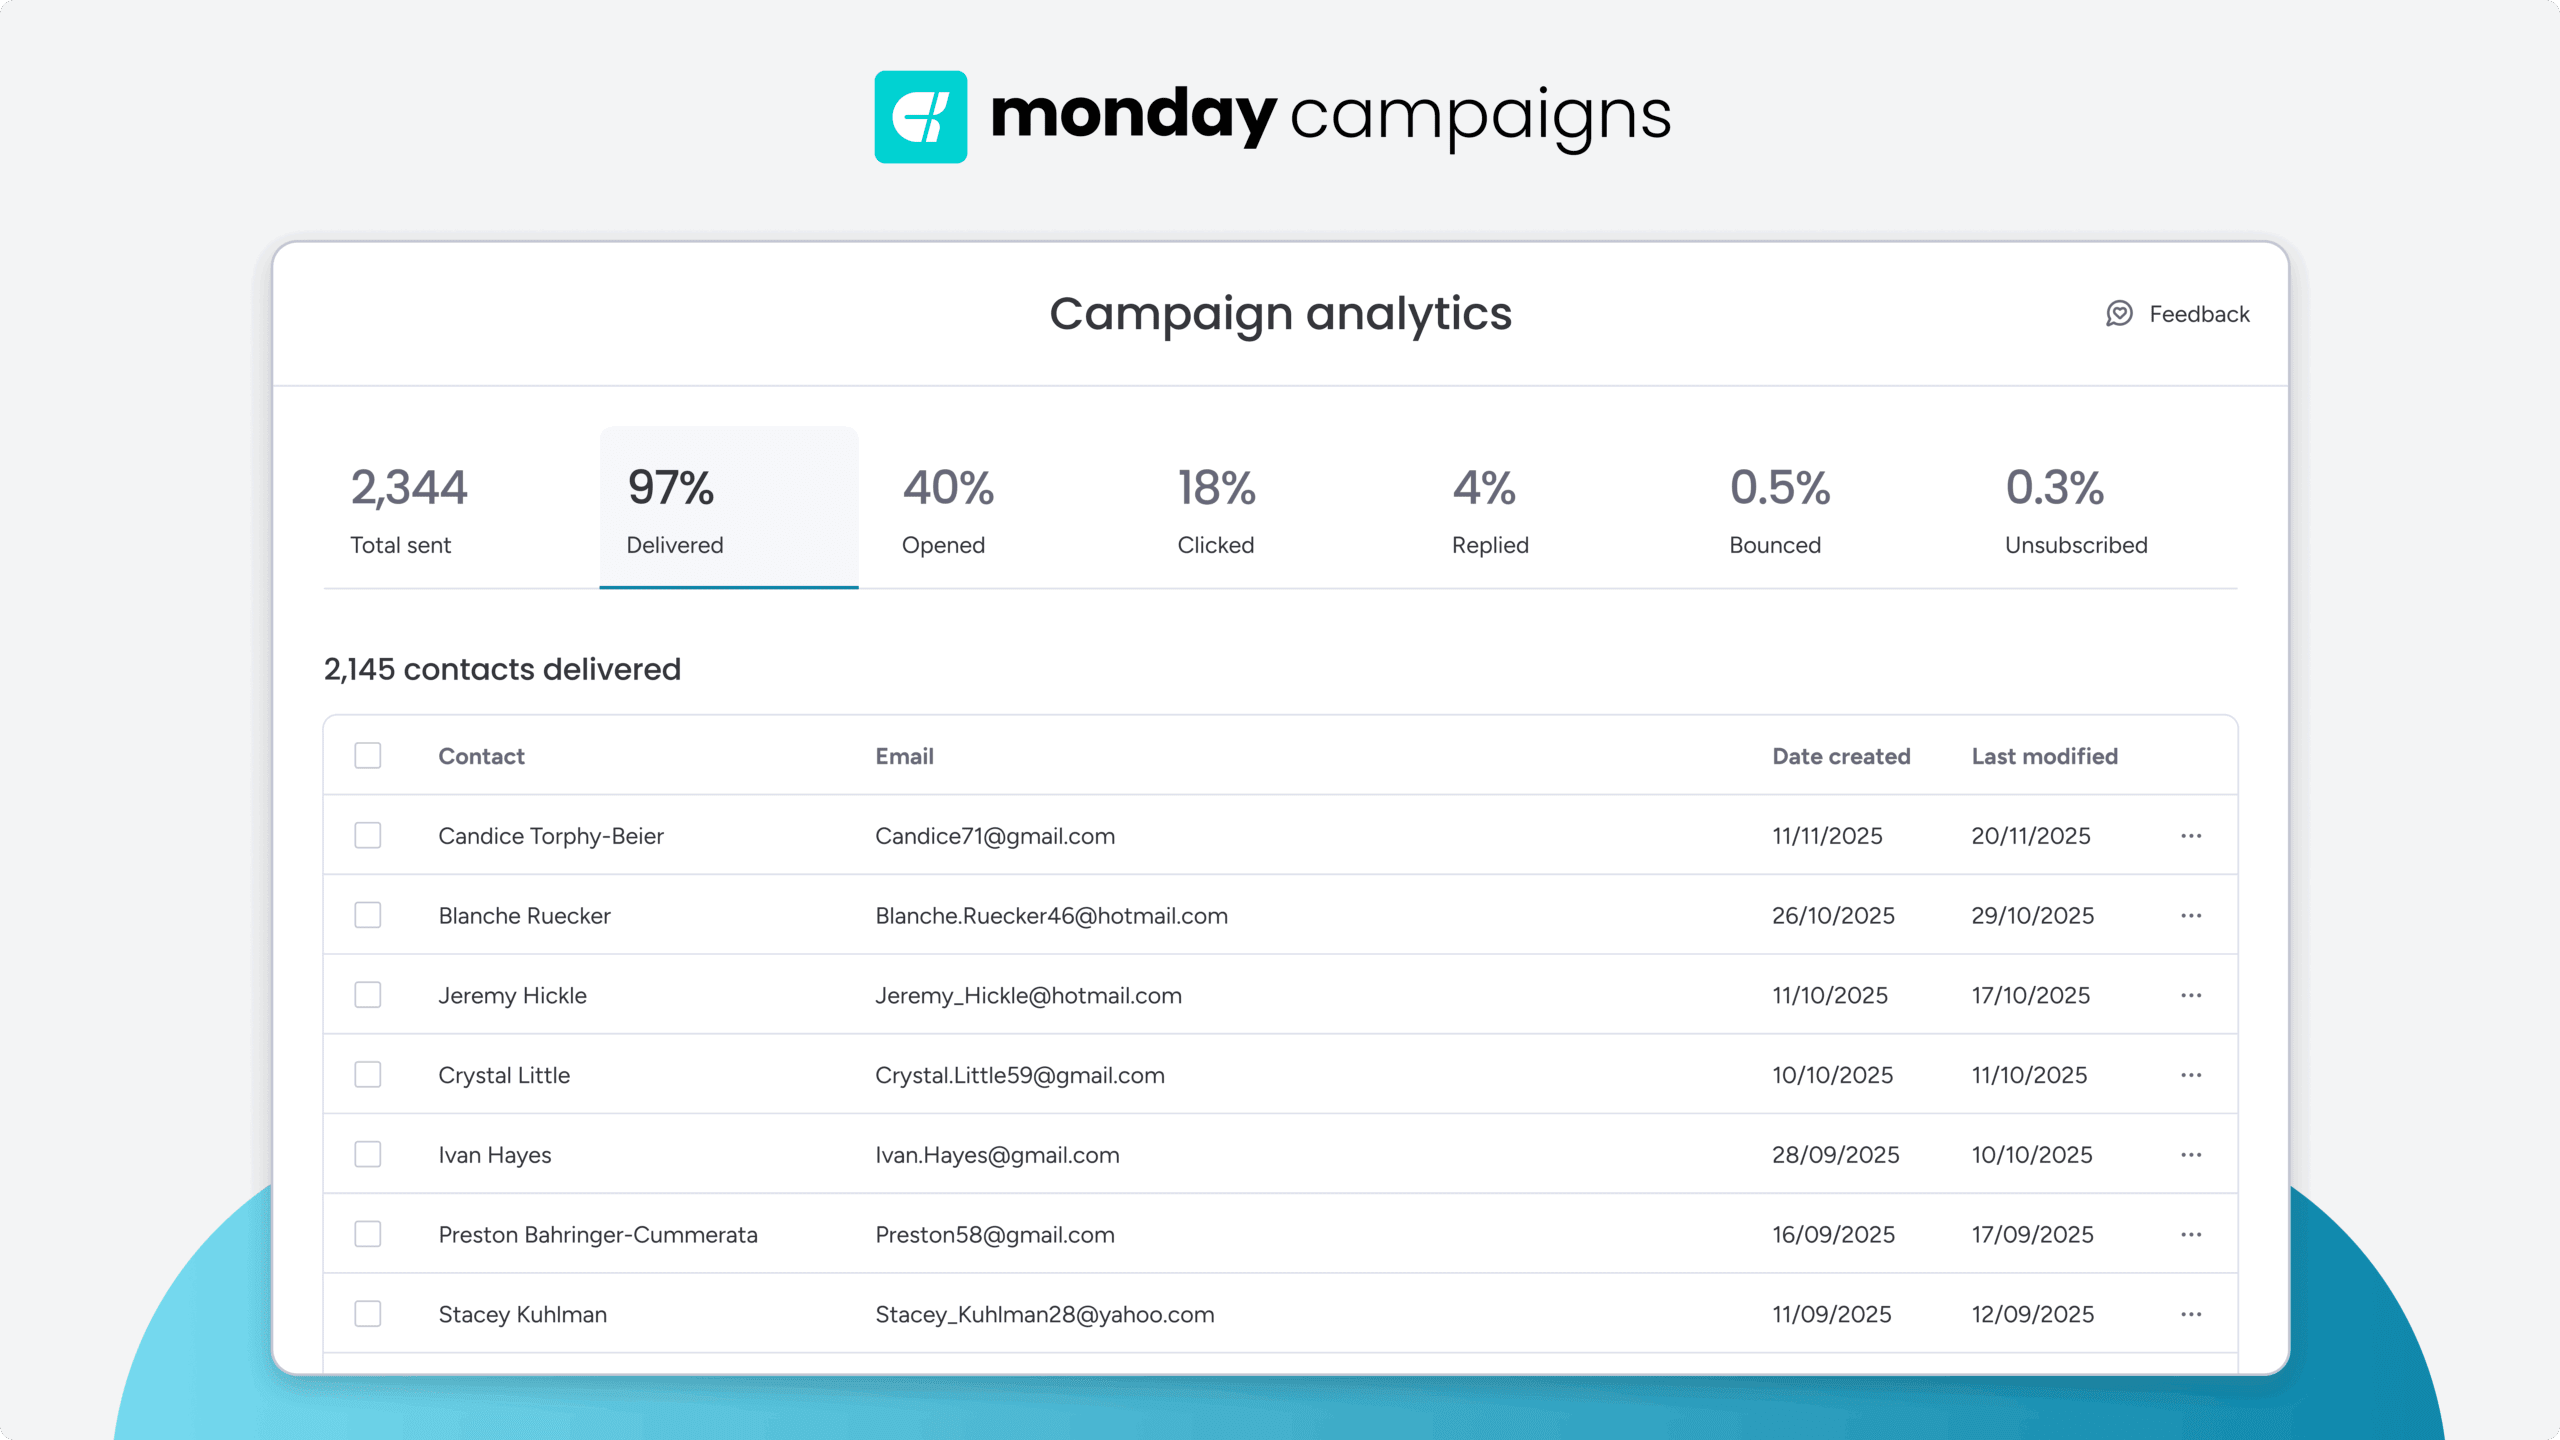 A good email open rate typically ranges from 15-25% across most industries. This percentage shows how many delivered emails recipients actually open, but what counts as “good” depends on your specific situation.
Is 30% a good open rate? On paper it looks strong, but the number needs context in 2026. Benchmarks swing widely by source and methodology, largely because of how each report handles automated opens. WebFX reports a cross-industry average of 19.21%, which gives you a grounded baseline to judge your own campaigns against. Because Apple’s Mail Privacy Protection can log an open before anyone reads the message, treat any single headline number as directional, and keep 15-25% in mind as a realistic human range for most industries.
Your industry plays a huge role. Nonprofits often see rates above 25% because their audiences actively want updates. Retail brands usually land between 16-20% since they send more promotional content through mass email campaigns. B2B companies hover around 18-22% with their targeted, professional messaging.
The quick answer to what’s a good email open rate
Most marketers should aim for a 15-25% open rate, which represents solid performance across industries. The ranges below reflect real, human open rates, so add roughly 15 points if your platform reports MPP-inflated numbers. That said, these ranges provide a quick snapshot of your email performance and signal where you have opportunities to grow:
Open rate range (adjusted) | Performance level | What it means |
|---|---|---|
20-25% | Strong performance | Your audience finds value in your content and trusts your brand |
15-20% | Industry average | You're meeting expectations but have room to grow |
Below 15% | Needs attention | Review subject lines, list quality, or sending frequency |
Why open rates are becoming less reliable
Beyond privacy updates, several other technical factors can distort your open rate data, making it an unreliable standalone metric. Recognizing these issues is the first step toward focusing on analytics that reflect true subscriber interaction.
- Image blocking: Some email clients prevent tracking pixels from loading
- Preview panes: These might count as opens even when recipients don’t fully engage
- Security bots: Automated systems that scan emails for threats can trigger false opens
Smart marketers now focus on metrics that show real engagement. Click-to-open rates, conversions, and revenue tell you more about campaign success than opens alone.
To put numbers on it, 2026 benchmark analysis estimates Apple Mail Privacy Protection inflates reported open rates by 15 to 20 points or more. When it preloads your tracking pixel, it logs an open even though no person opened the message. Security scanners and automated bots add more of these machine opens, so a headline open rate can look healthy while genuine attention stays flat. Most 2026 benchmark reports now treat this gap as the top reliability caveat for the year.
How mailbox privacy features affect open rates
Mail Privacy Protection preloads images on Apple devices, including the tracking pixel that measures opens. This happens whether someone reads your email or not. That means your reported open rates might look inflated without reflecting real engagement. If you suddenly saw open rates jump without more clicks or sales, Apple’s privacy features are likely why.
How to calculate your email open rate
Calculating open rates helps you understand campaign performance and spot trends. The math is straightforward, but knowing what counts matters more than the formula itself.
Here’s the standard calculation:
(Unique opens ÷ delivered emails) × 100
Let’s say you send 2,500 emails and 500 people open them. Your open rate is 20%. Notice we use “delivered” emails, not “sent” emails. Bounced emails never reach inboxes, so including them would unfairly lower your rate and impact email deliverability metrics.
What actually counts as an email open
Email platforms track opens using an invisible pixel image. When someone’s email client loads this image, it registers as an open. An email “open” isn’t as simple as it sounds, as platforms track engagement in different ways. To interpret your data correctly, it’s important to distinguish between the 2 primary types of opens.
- Unique opens: Individual recipients who open at least once
- Total opens: Every time the email gets opened, including multiple views by the same person
Unique opens matter most because they show your actual reach. Some email clients register opens differently. Preview panes might count, or they might not. These variations explain why comparing your performance to benchmarks beats fixating on exact numbers.
Automated tracking vs. manual calculation
Most platforms handle open rate calculations automatically, including monday campaigns, which provides real-time tracking that eliminates manual work and reduces errors. You get instant insights without spreadsheets or guesswork.
Manual calculation means exporting data and doing the math yourself. It’s time-consuming and error-prone. Automated solutions save time while providing context like device types and geographic data for deeper email marketing analytics.
Average email open rates by industry in 2026
Industry benchmarks help you set realistic goals and measure performance. What’s excellent in one industry might be average in another. Which industry has the highest open rates? Government, nonprofit, and education audiences consistently top the charts, while ecommerce, retail, and travel tend to sit lower. Understanding these differences helps you evaluate your campaigns accurately.
Industry | Average open rate | Good open rate | Excellent open rate |
|---|---|---|---|
B2B services | 18-22% | 22-25% | 25%+ |
Retail & e-commerce | 16-20% | 20-23% | 23%+ |
Nonprofit | 20-25% | 25-28% | 28%+ |
SaaS & technology | 17-21% | 21-24% | 24%+ |
Education | 19-23% | 23-26% | 26%+ |
Healthcare | 16-20% | 20-23% | 23%+ |
Financial services | 17-21% | 21-24% | 24%+ |
Source note: benchmarks vary by provider and methodology, so treat these ranges as directional. They reflect typical adjusted human open rates, and platform-reported rates often run higher because Apple Mail Privacy Protection counts automated opens. For a broader cross-industry view, WebFX publishes a full 2026 benchmark set.
B2B services email benchmarks
B2B services see 18-22% average open rates. Professional audiences check email regularly and expect relevant, targeted content. This focus on value drives higher engagement than consumer campaigns.
Retail and e-commerce open rates
Retail averages 16-20% open rates. Frequent promotional mass email campaigns can cause fatigue, but segmented campaigns perform much stronger. Targeting based on purchase history or browsing behavior beats generic mass email sale announcements.
Nonprofit email performance
Nonprofits enjoy 20-25% average open rates. Passionate supporters want mission updates and impact stories. This engaged audience responds well to personalized content that shows how their support makes a difference.
SaaS and technology benchmarks
Technology companies average 17-21% open rates. Regular product updates and educational content keep subscribers engaged. These audiences expect ongoing communication about the platforms they use daily.
What is a good open rate for cold email and B2B?
Cold emails reach people who haven’t opted in, so use cold outreach benchmarks rather than newsletter averages to assess performance.
According to 2026 cold email benchmarks, reported open rates average around 44%, with 45% or higher considered good. Apple Mail Privacy Protection can inflate these figures, while rates below 30% may warrant a review of deliverability and list quality.
Nurture emails reach contacts who already know your business. Compare cold and nurture engagement to identify where your messaging could be more relevant to a contact’s role or buying stage.
With monday campaigns, you can use CRM data to segment contacts and tailor messages to their stage in the customer journey.
Why CTOR is the new gold standard for email marketing
For many teams, the click-to-open rate (CTOR) is now a more reliable benchmark than open rate alone. Open rates can mislead you, and technical factors inflate them without showing real engagement.
CTOR connects directly to business outcomes by measuring actual interaction. It measures the percentage who click through, showing whether your content delivers on your subject line’s promise.
Calculate CTOR with this formula:
(Unique clicks ÷ unique opens) × 100
If 500 people open your email and 75 click, your CTOR is 15%. This tells you that once opened, your email has a 15% chance of driving action.
CTOR benchmarks that actually matter
Benchmarks vary widely by methodology, but 2026 analysis puts a good CTOR between roughly 6% and 17% depending on industry, with the strongest campaigns pushing higher. These numbers reflect content quality and relevance to your audience. Email type matters too, since urgency and intent shape how many openers click, so use the ranges below as directional guidance rather than fixed rules:
Email type | CTOR benchmark | Why it performs this way |
|---|---|---|
Newsletter emails | 8-12% | Informational content drives steady but not urgent clicks |
Promotional emails | 10-15% | Well-targeted offers generate higher engagement |
Transactional emails | 15-25% | Immediate relevance (orders, resets, confirmations) |
Welcome series | 20-30% | New subscribers are highly engaged and exploratory |
What factors influence your email open rates?
Subject lines, sender names, timing, and list quality can all influence open rates. Review these factors to find opportunities to make your campaigns more relevant.
Subject lines
Give recipients a reason to open with a concise subject line that highlights the value of your email. Test personalization, curiosity, or time-sensitive language, and use AI in monday campaigns to generate copy ideas.
Sender name
Choose a recognizable sender name, such as your company name or “Sarah from Company.” Keep it consistent so recipients can build familiarity with your emails over time.
Send time and frequency
Test different days, times, and sending frequencies to find what works for your audience. Monitor engagement and unsubscribes to establish an email cadence that fits their preferences.
Email list quality and segmentation
Review your list every 3–6 months and consider removing inactive subscribers to support email deliverability. With monday campaigns, you can use CRM data to create dynamic segments and tailor messages to your audience.
AI strategies to improve email open rates
 AI can help you identify patterns in your campaign data and find opportunities to make your emails more relevant. The strategies below explore how AI can support everything from subject lines and send times to segmentation and re-engagement.
- Predictive subject line generation: AI analyzes past campaigns to suggest high-performing subject lines based on patterns in language and structure that resonate with your audience.
- Optimal send time automation: AI uncovers when each subscriber most likely checks email to suggest ideal send times and adapts as behavior changes.
- Dynamic personalization at scale: AI incorporates behavior, purchase history, and engagement patterns to suggest truly personalized content.
- Continuous A/B testing: AI can test multiple variables simultaneously and identify winners so you can automatically apply the best performers.
- Smart audience segmentation: AI helps you create dynamic segments based on real-time behaviors and enhance targeting with sales and customer data.
- Real-time performance optimization: AI suggests adjustments to campaign elements based on early performance indicators.
- Intelligent re-engagement campaigns: With AI, you can set up automatic, personalized triggers for win-back sequences based on past interests and behaviors.
Make every email more relevant with monday campaigns
A strong email campaign starts with an understanding of your audience. When marketing and sales work from shared customer information, they can align their messages with customer needs and business goals.
Part of the monday CRM suite, monday campaigns helps teams create and refine campaigns with that context in mind. It also gives marketers a way to assess engagement beyond open rates alone.
Generate on-brand email copy with AI
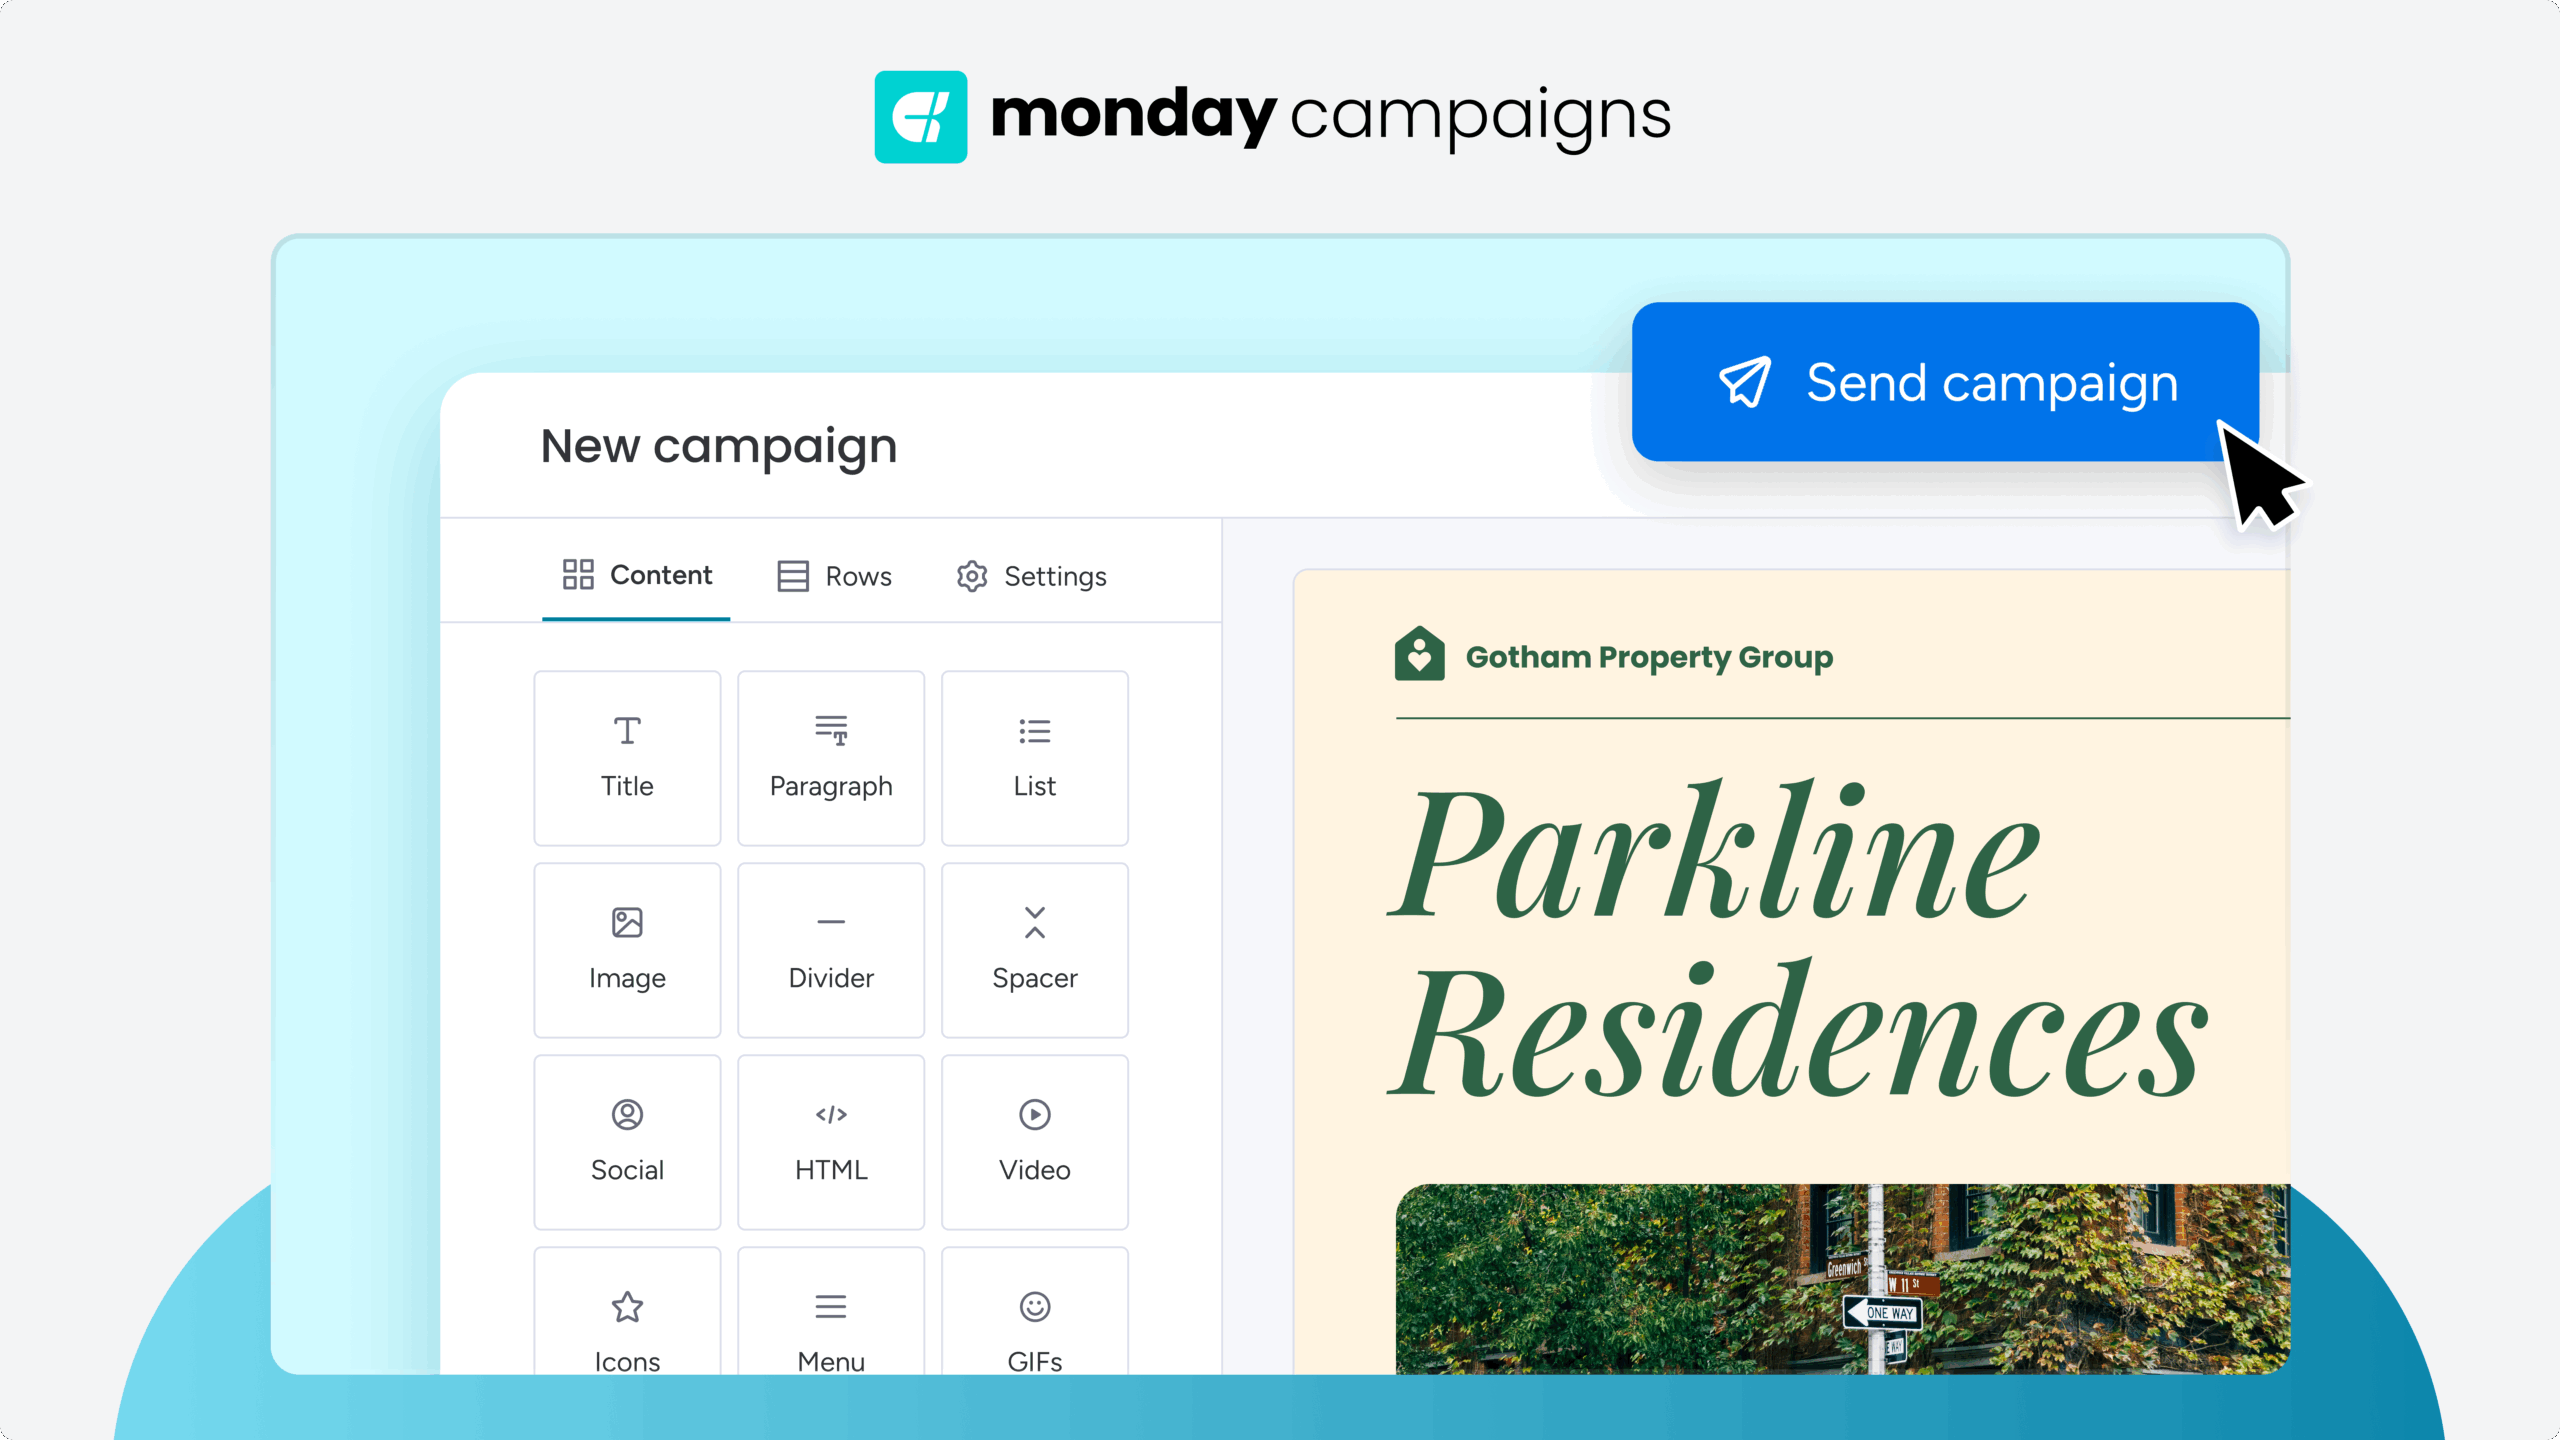
Use AI in monday campaigns to generate on-brand email copy and explore subject line ideas. You can adapt the suggestions to match your campaign goals and audience. After launch, compare open rates and clicks to see how recipients respond. Apply those insights to your next campaign and continue refining your message.
Plan send times with AI recommendations
Use AI-recommended send times as a starting point for your campaign schedule. Compare results across campaigns to see when your audience engages with your emails. Keep an eye on unsubscribes as you test different sending frequencies. Over time, these insights can help you establish a cadence that suits your audience.
Find relevant audiences with AI and CRM data
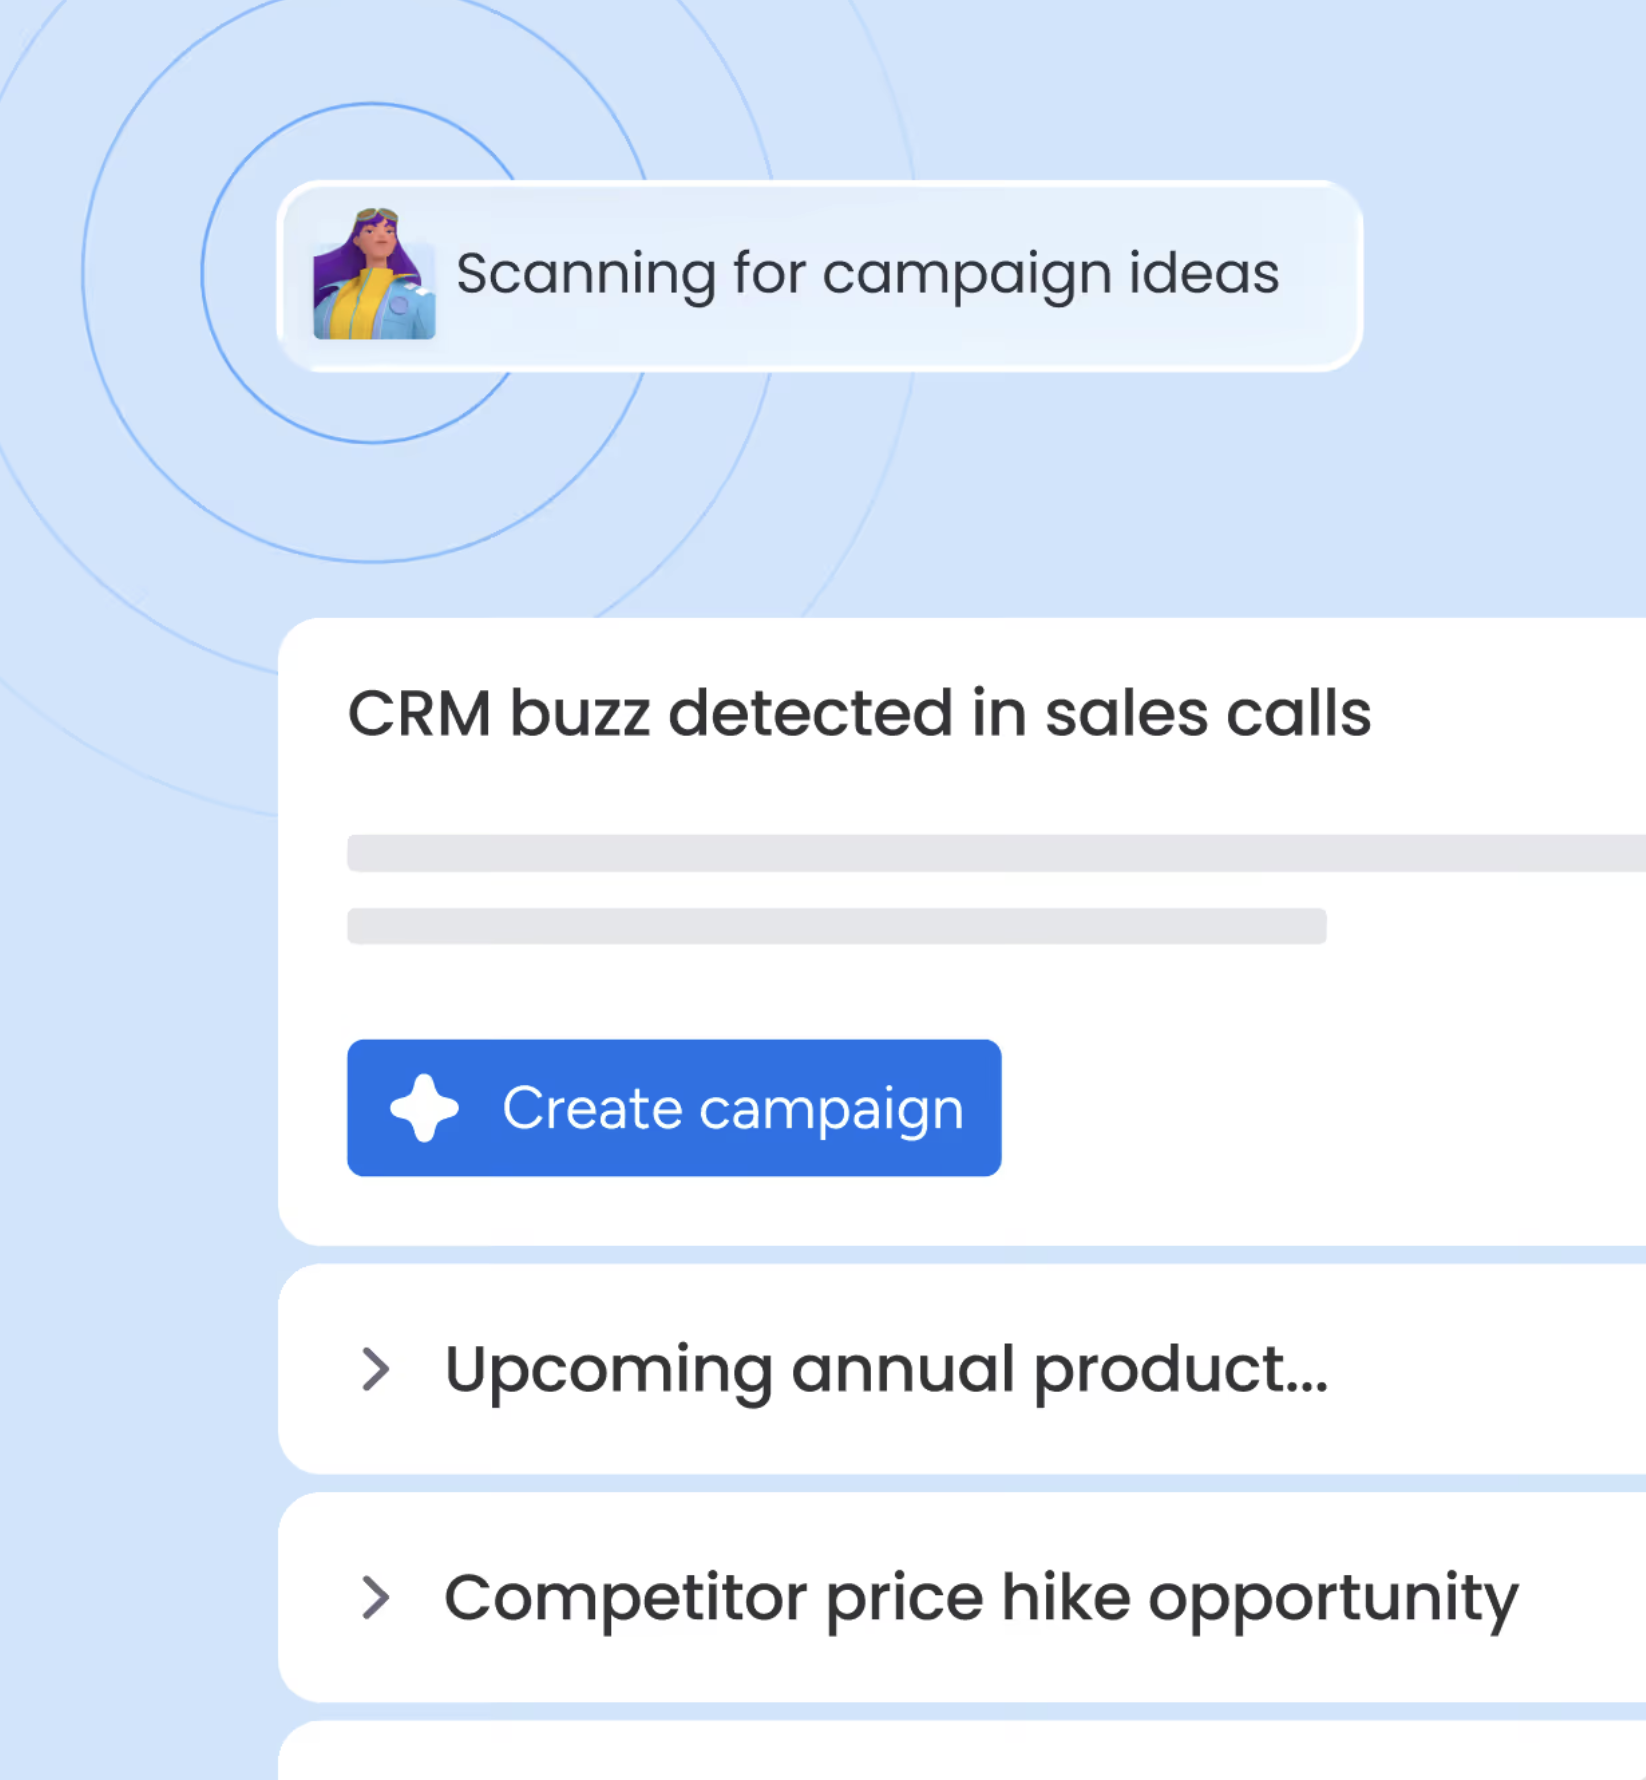
Use AI to suggest audience segments based on customer information in monday CRM. Then, tailor your messages to the interests and needs of each group. Dynamic segments update as contact information changes, helping you keep your audience lists current. With shared customer data, marketing and sales can coordinate their communications throughout the customer journey.
Track engagement and refine your message
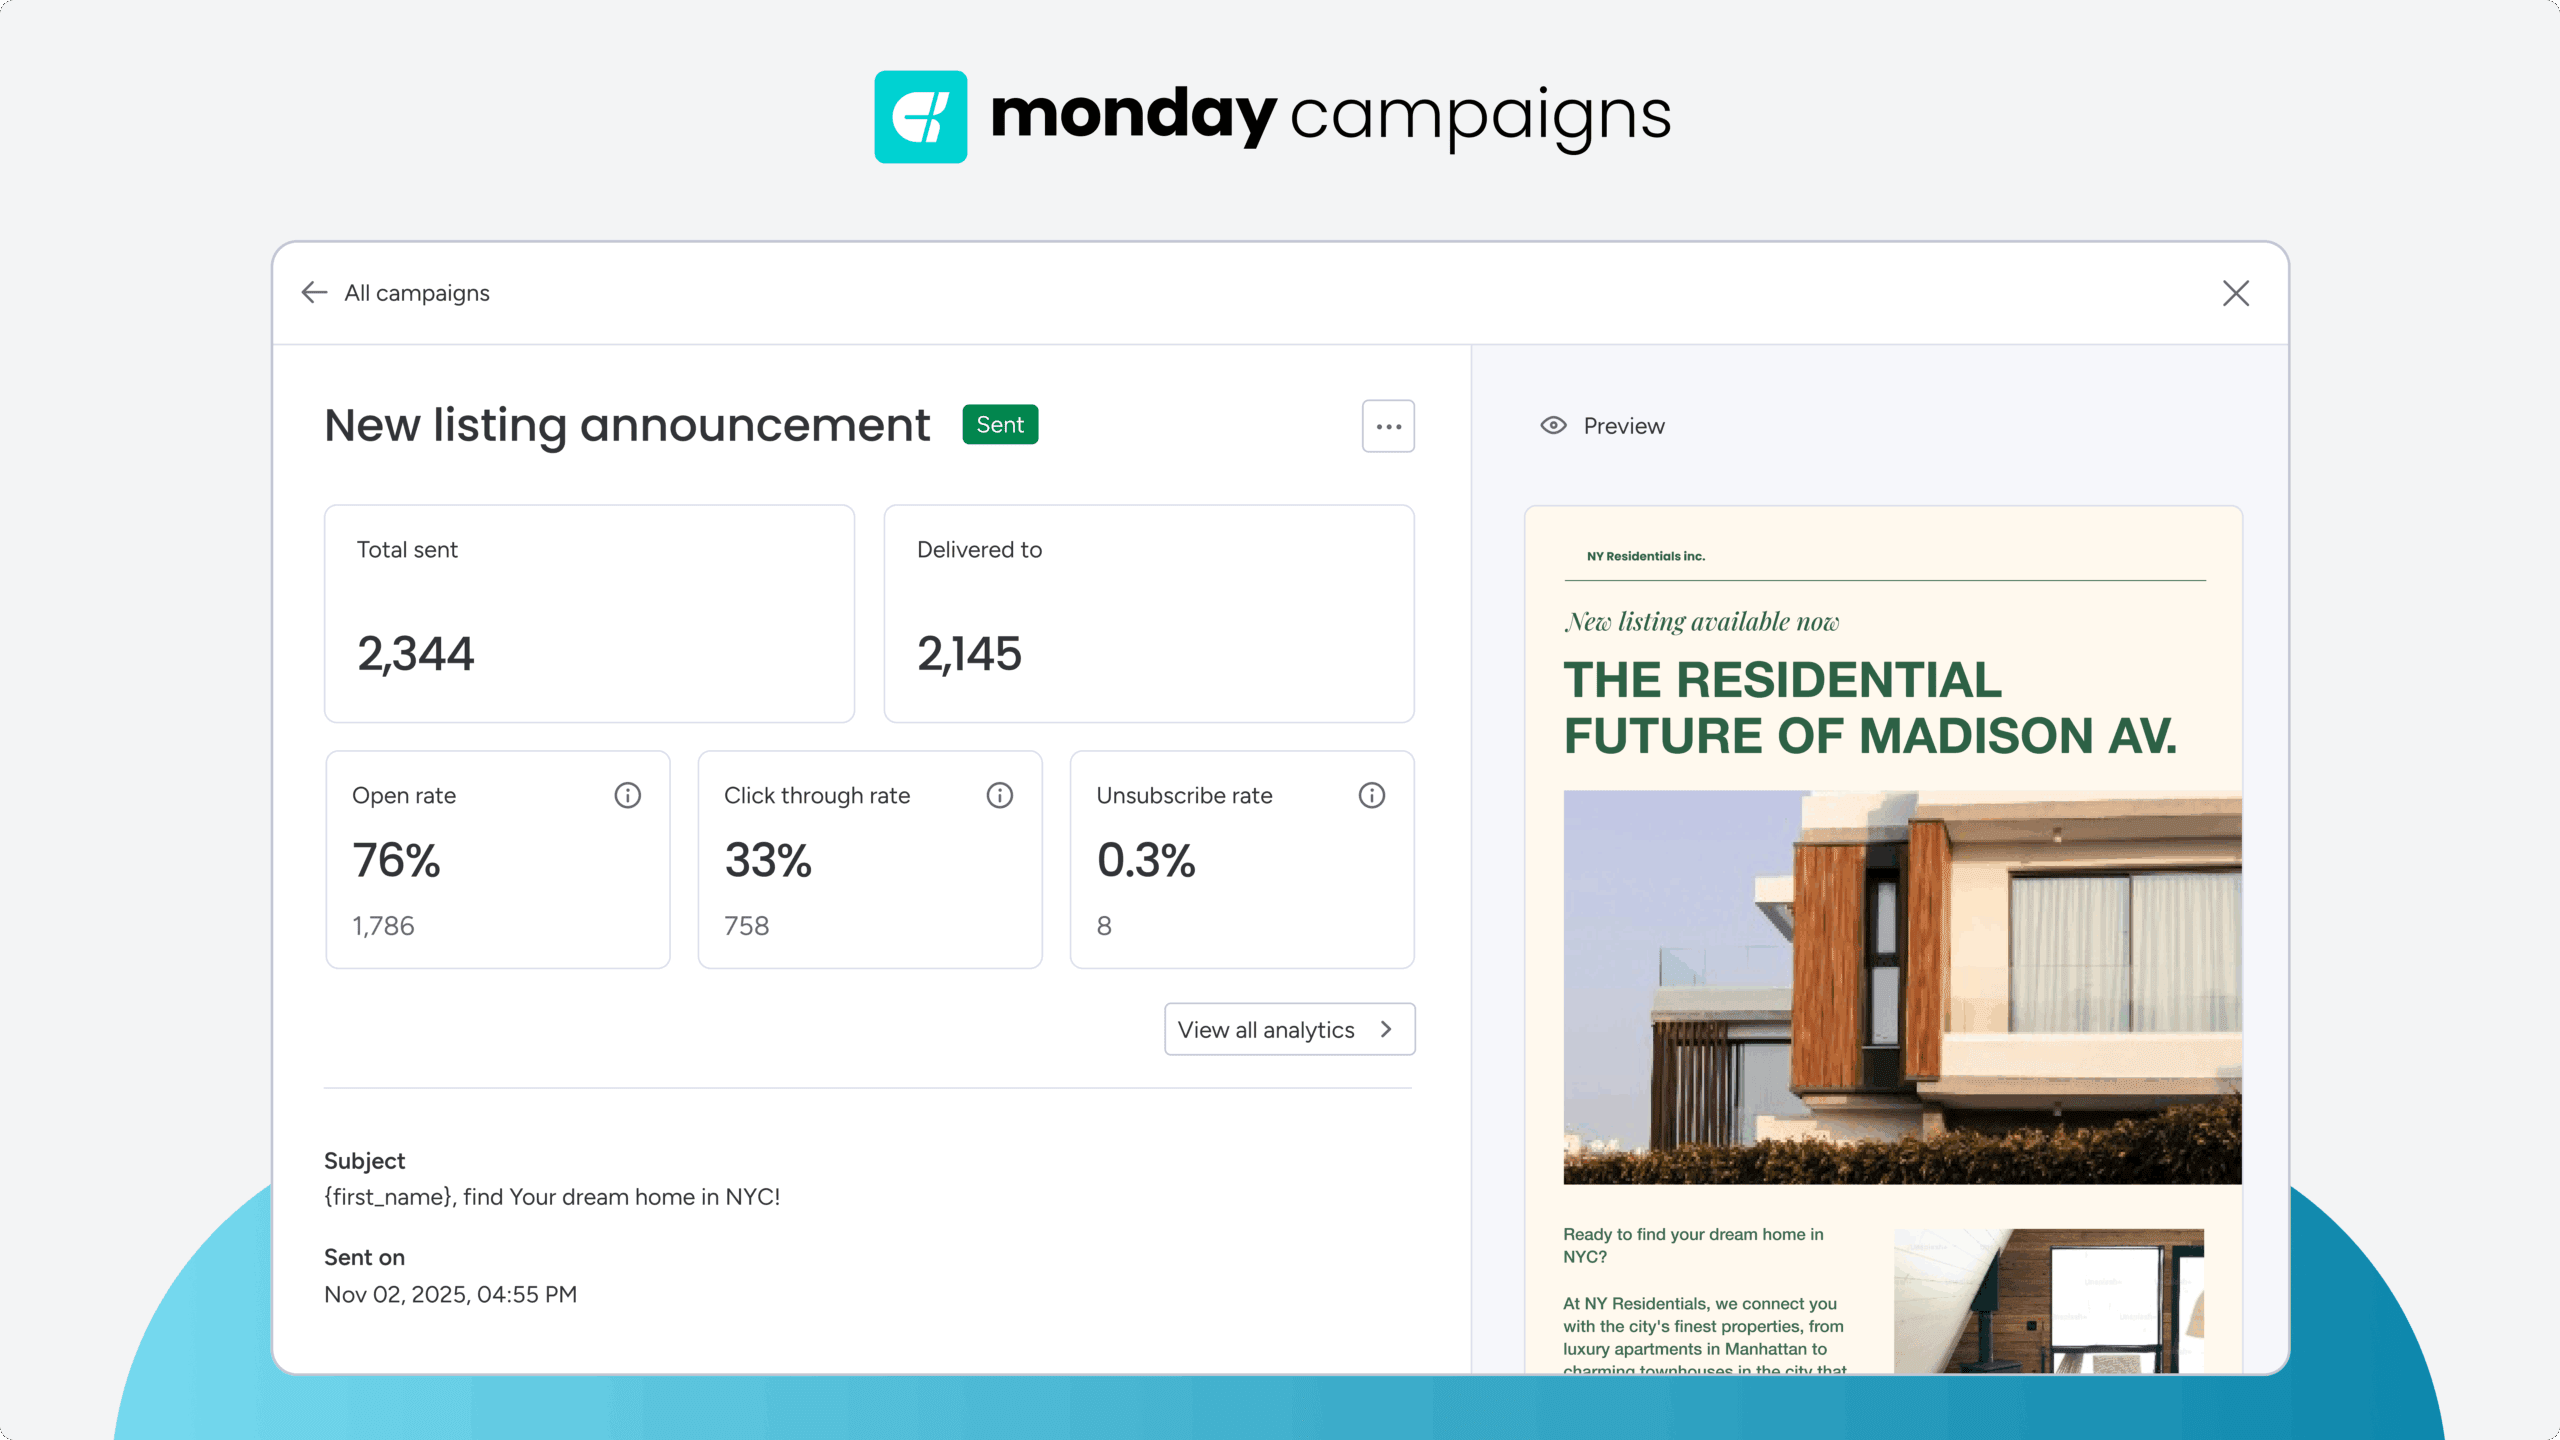
Monitor open rates, click rates, and unsubscribes in monday campaigns to understand how recipients respond. Connect campaign reporting with CRM data to see how engagement relates to lead conversion. Review these results alongside AI-powered sales insights to identify opportunities to adjust your messaging. As customer needs change, apply what you discover to future campaigns.
Turning open rates into real revenue signals
So what is a good open rate for email in 2026? It’s a directional guide, not a verdict. Benchmarks tell you where you stand, but they only matter once you separate reported numbers from real human attention.
Click-to-open rate, conversions, and revenue tell the fuller story of whether your emails earn action. Relevance, timing, and clean data are what lift genuine opens, and connecting those signals to your CRM turns a vanity metric into a revenue signal you can act on with confidence.
FAQs
How often should I clean my email list to maintain good open rates?
Clean your email list every 3-6 months by removing subscribers who haven't engaged in 6 months or longer to maintain deliverability and stay aligned with CAN-SPAM compliance. Regular list hygiene prevents unengaged contacts from dragging down your open rates.
Do emojis in subject lines hurt email open rates?
Emojis in subject lines do not necessarily hurt open rates and can even boost them when used sparingly, typically 1 or 2 per subject line maximum. Test emojis with your specific audience to determine whether they enhance engagement.
What day of the week gets the highest email open rates?
The days of the week that get the highest email open rates are typically Tuesday through Thursday. Your optimal send day depends on your specific audience and industry, making testing essential.
How many marketing emails per week is too many for open rates?
To avoid hurting your open rates, the ideal frequency is typically 1 to 3 marketing emails per week. The ideal frequency depends on your content value and subscriber expectations.
Should I segment email sends by time zone for better open rates?
Yes, you should segment email sends by time zone for better open rates, as this strategy ensures emails arrive during optimal hours for each recipient. This particularly benefits global audiences.
Is 30% a good open rate for email campaigns?
Yes, 30% is a good open rate for email campaigns. It exceeds industry averages significantly and indicates exceptional audience engagement and an effective email strategy.
What is a good open rate for cold email?
A good open rate for cold email is 45% or higher in reported terms, though those numbers are heavily inflated by Apple's privacy features. Reported cold outreach averages sit near 44%, so anything below 30% usually points to a deliverability or targeting problem.
How does monday campaigns help improve email open rates?
monday campaigns helps improve email open rates by connecting every send to live CRM data, so segments stay relevant to each contact's deal stage. It also adds AI send-time recommendations and campaign performance tracking that shows open rate, click rate, and unsubscribes in one place.

 Get started